Creating Twitter Conversation Networks
**These instructions are based on Kim Holmberg's PowerPoint presentation (please save as filetype .pptx rather than .zip to view it**
These notes summarise how create two types of network of conversations in Twiter. The notes describe how to create the networks from Tweets that have already been collected by you. The notes here describe how to create the following types of information.
- Co-mention networks for @users
- Direct tweet networks of who tweets whom for @users
If you want lists of top terms or hashtag networks, see the advanced network creation instructions.
Summary of key steps
- Collect tweets
- Filtering the tweets to remove spam and duplicate tweets
- Create the networks
Collecting tweets
It is no longer possible to download tweets with Webometric Analyst. There are some functions to analyse data collected before Twitter/X stopped free data sharing.
Filtering out spam and duplicate tweets
To remove the pure retweets (i.e. Tweets starting with RT)
- EITHER: open the file containing the tweets in Excel and sort the data according to the tweet content column. Then delete the rows starting with RT;
- OR: select Split file into two based on matching text from the Text menu in Webometric Analyst, select the file containing the tweets, and enter ”<tab>RT” as the text to split the file on, where <tab> represents a tab key and the quotes should not be typed. Then use the ”noMatch” file created by this process, which will have the retweets filtered out.
Removing Via tweets
To remove any occurences where the tweet has been sent ”via @username”
- EITHER: open the file in Notepad Plus Plus (or Notepad, but Notepad Plus Plus is much faster for this kind of task) and then Replace text strings like ”via @” with for instance ”via _AT_”.
- OR: select Replace text A with text B everywhere in file from the Text menu in Webometric Analyst, select the file containing the tweets, and enter ”via @” as the text to find and ”via _AT_ as the text to replace. Then use the ” _changed” file created by this process.
In the next step extracting the usernames from the tweets these retweets will not be included, because Webometric Analyst uses the @-sign as an identifier of usernames.
Creating Twitter Conversation networks (see pictures in this PowerPoint presentation -please save as filetype .pptx rather than .zip to view it)
- Open Webometric Analyst and go to the Twitter tab.
- Click on the button saying ”Create tweeter-@tweetee and ...”
-
Select the file from which you have removed the retweets
-
Then select the column containing the tweets and the column containing the author URLs in the next two dialog boxes
-
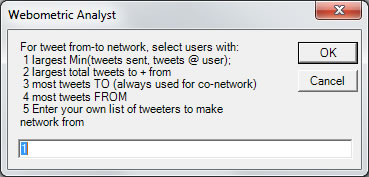
Depending on your research goals, select what kind of network you want to create from the tweeter – tweetee connections:
-
1. For each user, this calculates the minimum of the number of tweets sent by them, and the number of tweets sent to them. The tweeters are then selected with the largest of these minimum values.
-
2. For each user, this calculates the number of tweets sent by them and adds it to the number of tweets sent to them. The tweeters are then selected with the largest of these values.
-
3. For each user, this calculates the number of tweets sent to them. The tweeters are then selected with the largest of these values.
- 4. For each user, this calculates the number of tweets sent by them. The tweeters are then selected with the largest of these values.

-
Enter the maximum number of nodes for the network. Depending on your research goals and if you continue to analyse the network in Gephi or Pajek you can increase the number of nodes from the suggested 50. Note: If you put a very large max here, such as 20,000, you might get a system-out-of-memory-error when WA is calculating either the network or the information files. To fix this, try fewer nodes or a computer with more memory (RAM). The TweeterTweetee-file should always be OK.
-
Next enter a filename for the results
-
Depending on what you’ll do in the next steps of your project select to use either raw numbers (click YES) or the scaled numbers (to view the network mainly in Webometric Analyst Network) (click NO).
- Now Webometric Analyst will draw the network and asks if you want it to cluster minor nodes around major nodes and hide their labels. If you continue your analysis with Gephi or Pajek, this step doesn’t influence your data.
-
Webometric Analyst will then draw the network and save the network file. To learn about the functions in this network visualization tool, consult the manual for Webometric Analyst Network.
The files below are produced by the above analysis.

The ..._centrality.txt file contains the (social network analysis) centrality scores of the nodes (=usernames). Both Arrow.Info –files are used by the built-in network visualization tool in Webometric Analyst.
The ...communicators.net file contains a network in which the nodes are Twitter users and the arrows between them have thicknesses proportional to the number of tweets sent from the arrow source node to the arrow target node.
The ...cotweeted.net file contains a network in which the nodes are Twitter users and the lines between them have thicknesses proportional to the number of tweets sent simultaneously to both of them ( e.g., ”@jim @naz morning” is a co-tweet between jim and naz, no matter who sent the tweet).
These .net files can be analyzed in WA Network, Gephi or Pajek. For many research goals choosing the appropriate type of network from the 5 options earlier and analysing the resulting network files in WA Network or Gephi would be enough. However, if you want to use the number of connections between the tweeters and tweetees (instead of using combinations of the number of tweets sent and received) you’ll need to continue with the ...TweeterTweetee.txt file.
The ...TweeterTweetee.txt file contains a list of the tweet sources and targets. If a tweet is sent to multiple targets, then there is one line per source-target pair. This file can be used to create a simple network of the conversational connections in the tweets. In the Networks menu there’s a function called: Convert columns of text into co-occurrence or link network (Pajek). This will convert the TweeterTweetee file into a network for people that either send or receive a tweet.
What are co-mention networks?
Co-mention networks are networks based upon how often words, hashtags or users co-occur in tweets. For instance, if the data set contains the following three tweets:
- [From @rajvordeman] Hello @ mikethelwall and @amitabhbachchan
- [From @mikethelwall] @rajvordeman is @amitabhbachchan at #work?
- [From @mikethelwall] @amitabhbachchan are you at #work or #pub?
Then in terms of the three types of co-mention:
- There is one co-mention of @ mikethelwall and @rajvordeman (tweet 1) and one co-mention of @rajvordeman and @amitabhbachchan (tweet 2)
- There is one co-mention of #work and #pub (tweet 3)
- There are lots of co-mentions of individual terms (e.g., is and at in tweet 2).
To obtain co-mention networks of any type complete the following instructions.
- Using Windows Notepad or a more powerful alternative such as Notepad Plus Plus (but not a word processor), create a plain text file listing all the words/users/hashtags that you would like to calculate co-mentions for. This should normally be the top 50 words/users/hashtags extracted using the section above.
- If you haven't done it already, create the plain text label file, as described in the section above.
- Start Webometric Analyst and select menu item: Tab-sep. text| Make co-occurrence matrix and Pajek file for word list or user list using col m of file [e.g., after listing the top words/tweeters/hashtags above]
- Follow the Webometric Analyst instructions about file selection, column numbers etc. carefully and wait for it to finish. Make sure that you say Yes to including hashtags and @ symbols in the results.
- This produces two files, a matrix and a Pajek network file.
- To read the matrix, load it into a spreadsheet.
- To view the network, either load it into Pajek (if you are familiar with it) or follow the instructions below to load it into Webometric Analyst's network drawing part. For the latter, start Webometric Analyst and select menu item: File| Draw Network and then load the network either using the File|Load command or by dragging the filename onto the title bar. To arrange the network neatly, select the menu item: Layout|Automatic. To colour in the network very approximately by community, select menu item Partition|Colour network by Community|As many communities as possible. More information about drawing networks is available.
Creating direct tweet networks for @users
Direct tweet networks are based upon how often tweets from one @user contain the names of other @users. For example, consider the tweets:
- [From @rajvordeman] Hello @ mikethelwall and @amitabhbachchan
- [From @mikethelwall] @rajvordeman is @amitabhbachchan at #work?
- [From @mikethelwall] @amitabhbachchan are you at #work or #pub?
Then in terms of messaging:
- @rajvordeman -> @mikethelwall has a count of 1 (tweet 1)
- @mikethelwall -> @rajvordeman has a count of 1 (tweet 2)
- @mikethelwall -> @amitabhbachchan has a count of 2 (tweets 2 and 3)
To obtain direct tweet networks complete the following instructions.
- Using Windows Notepad or a more powerful alternative such as Notepad Plus Plus (but not a word processor), create a plain text file listing all the @users that you would like to calculate messages between. This should normally be the top 50 @users extracted using the section above although you may have a reason for creating a different list.
- If you haven't done it already, create the plain text label file, as described in the section above.
- Start Webometric Analyst and select menu item: Tab-sep. text| Make direct tweet frequency matrix and Pajek file for user list using col m of file [e.g., tweeters list, tweets]
- Follow the Webometric Analyst instructions about file selection, column numbers etc. carefully and wait for it to finish.
- This produces two files, a matrix and a Pajek network file.
- To read the matrix, load it into a spreadsheet.
- To view the network, either load it into Pajek (if you are familiar with it) or follow the instructions below to load it into Webometric Analyst's network drawing part. For the latter, start Webometric Analyst, close the Wizard by clicking the top-right hand corner X sign, and select menu item: File| Draw Network and then load the network either using the File|Load command or by dragging the filename onto the title bar.
- To arrange the network neatly, select the menu item: Layout|Automatic.
- To colour in the network very approximately by community, select menu item Partition|Colour network by Community|As many communities as possible. Alernatively, if you have logical categories for the nodes already, colour in the nodes yourself using a different colour for each category. Right-clicking on a node gives a menu that includes an option to colour a node.
- More information about drawing networks is available.
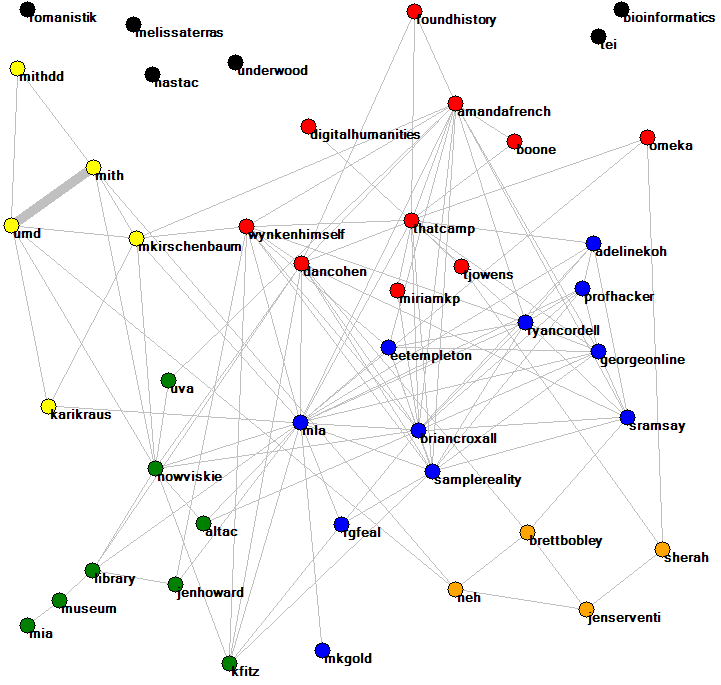
Example: The network below was created from digital humanities tweets, using the option to ignore @ and # symbols when processing the data so hashtags, usernames and keywords are all mixed up. The network was drawn with webometric analyst and manually tidied up by moving nodes around to make the pattern clearer and recolouring the digitalhumanities node from blue to red.
