Basic Webometric Analyst Link Analysis Tutorial
This page describes how to use the basic features of Webometric Analyst (via its wizards) to generate two types of report or a network diagram.
- Create a network diagram with the Webometric Analyst Wizard [What is this?]
- Create a link impact report (LIRe) with the Webometric Analyst Wizard [What is this?]
- Create a web impact report (WIRe) with the Webometric Analyst Wizard [What is this?]
A few less common types of Web Impact Report can also be created but for this the classic interface will be needed rather than the Wizards.
Creating a network diagram with the Webometric Analyst Wizard
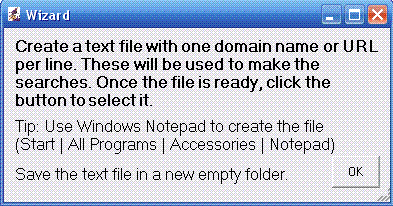
A network diagram can be created in a few steps. First, download Webometric Analyst from this web site, if you have not already done so. Second, get a Windows Cognitive Services key to unlock the web search facility and enter it into the box in the Wizard. Third, create a plain text file with one domain name per line. The easiest way to create a plain text file is to use Windows Notepad (normally accessed via Start|All Programs|Accessories|Notepad). Each line should contain just the domain name of the web site and not any additional file or path information and there should not be any extra spaces in the file or blank lines. Here is an example. Once the file is created, start Webometric Analyst, select Link Analysis Wizard from the File menu, enter your key and select the Network Diagram option from the first Wizard screen and click OK.
The second wizard screen requests the plain text file with the domain names: click OK and select the file in the dialog box that appears.
Once the file is selected, Webometric Analyst will start gathering data and when this is finished will display a network diagram, but this may take several minutes. The circles in the network diagram will have areas proportional to the number of pages in the web site that they represent and the arrows in the network diagram will have widths proportional to the number of URL citations that they represent. All data on the diagram can be derived from Bing searches.
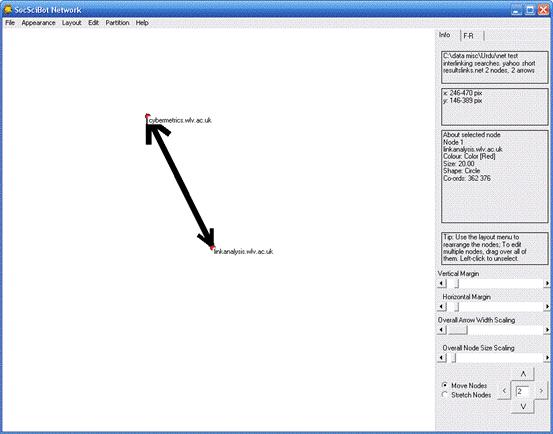
Once the network has been displayed, it is important to arrange it so that it is readable and the patterns are easily visible to a human reader. To achieve this, the circles should be moved around so that they do not overlap or intersect with lines and so that the lines themselves intersect as little as possible. It is also helpful to position circles close together if they interlink and further apart if they do not, as far as possible. This rearrangement can be achieved manually or with the help of the Fruchterman-Rheingold positioning algorithm.
The network diagram and positions can be saved by Selecting Save As from the File menu and saving as a SocSciBot Network file type. Alternatively, the network can be saved as a Pajek network, although in this format less information may be saved.
A network can be printed using the Print option in the File menu. There are various ways in which a network can be included another document, such as a Word file. The options below list various ways, in increasing order of image quality.
- Paint Bitmap: press the Print Scr button on the keyboard, load Microsoft Paint (Start|All Programs|Accessories|Paint) and press Control-V. This should copy the screen into the Paint program, where it can be edited down to the correct size. Once edited, the file can be saved (as a bitmap .bmp for the highest resolution, or as a GIF .gif for the smallest file size) and then incorporated into a document (e.g., in Word, using Insert|Image|From File).
- Medium resolution TIF. Within SocSciBot Network, select File|Print and then choose the Microsoft Office Document Image Writer printer driver from the Printer dialog box (in the Printer Name section). Use this to print a .TIFF version of the network, which can be inserted into a document, as for option 1.
- High resolution TIF. A high resolution TIF printer driver is normally needed to get a higher resolution file than 300dpi. Once this is installed (it will probably have to be bought) follow the instructions for 2 above, except selecting the new printer driver.
Different network diagram variations can be created than the standard one. To create a co-inlink diagram instead of a direct link diagram, follow the same instructions as above but in the first step check the “Show Advanced Options” box and then an additional Wizard dialog box will eventually appear. This will give the option to run co-inlink searches instead of direct link searches. Check this option and wait for the co-inlink diagram to be created.
A few less common types of co-inlink diagram can also be created but for this the classic interface will be needed rather than the Wizards.
Creating a link impact report (LIRe) with the Webometric Analyst Wizard
A Link Impact Report (LIRe) can be created in a few steps with Webometric Analyst. First, download the program from this web site if you have not already done so. Second, get a Windows Cognitive Services key to unlock the web search facility. Third, create a plain text file with one domain name or URL per line. The easiest way to create a plain text file is to use Windows Notepad (normally accessed via Start|All Programs|Accessories|Notepad). Each line should contain just the domain name of the web site and not any additional file or path information and there should not be any extra spaces in the file or blank lines. Here is an example. The only exception is that if a web site shares its domain name with another web site then the full URL of the home page of the site should be given rather than the shared domain name. Here is an example of this. Once the file is created, start Webometric Analyst, select Link Analysis Wizard from the File menu and enter your key, then select the Link Impact Report (LIRe) option from the first Wizard screen and click OK.
The second wizard screen requests the plain text file with the domain names and/or URLs: click OK and select the file in the dialog box that appears.
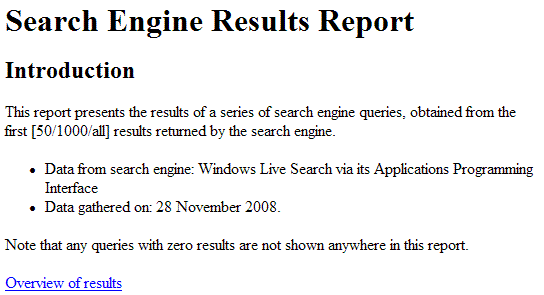
Once the file is selected, Webometric Analyst will start gathering data and after several minutes or half an hour will display a report in the form of a set of interlinked web pages. The main table, accessed by clicking the Overview of results link, contains the number of URLs, domain names, web sites, STLDs and TLDs linking to each web site. For the rows in the table containing web sites with just a domain name, the figures are for URL citations for anywhere in the web site matching the URL citation URL. All data in the report can be derived from Bing searches. Here is an example report comparing the web impact of similar web sites (a graph and certification have been added to the report).
Creating a web impact report (WIRe) with the Webometric Analyst Wizard
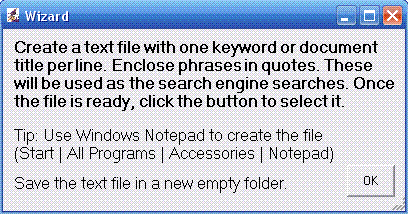
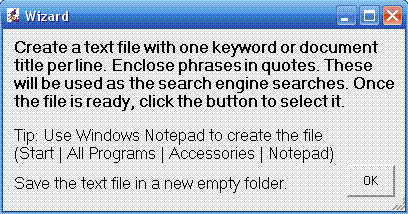
A Web Impact Report (WIRe) can be created in a few steps with Webometric Analyst. First, download the program from this web site if you have not already done so. Second, get a Windows Cognitive Services key to unlock the web search facility. Third, create a plain text file with one search term or phrase. The easiest way to create a plain text file is to use Windows Notepad (normally accessed via Start|All Programs|Accessories|Notepad). Each line should contain one search term or phrase, as would be entered into Google for a single search and there should not be any extra spaces in the file or blank lines. If any search is several words then it can be put into quotes (straight quotes rather than smart quotes) to ensure that the words occur consecutively in any matching documents. Here is an example. Once the file is created, start Webometric Analyst, select Link Analysis Wizard from the File menu, enter your key and select the Web Impact Report option from the first Wizard screen and click OK.
The second wizard screen requests the plain text file with the searches: click OK and select the file in the dialog box that appears.
Once the file is selected, Webometric Analyst will start gathering data and after several minutes or half an hour will display a report in the form of a set of interlinked web pages. The main table, accessed by clicking the Overview of results link, contains the number of URLs, domain names, web sites, STLDs and TLDs matching each search term or phrase. All data in the report is derived from Live Search. Here is an example report comparing the web impact of similar books (a graph and certification have been added to the report).
