
Big Data Text Analysis
Home -- Download -- Instructions -- FAQ
 |
Big Data Text AnalysisHome -- Download -- Instructions -- FAQ |
This page gives examples of Twitter time series graphs from Mozdeh and brief discussions of the patterns revealed. The purpose of these examples is to give ideas about what to look for in the time series graphs. There are three case studies: Syria 2012, UK Riots 2011, and earth conference 2012.
These graphs are taken from a Twitter corpus built from a set of Syria-related queries.
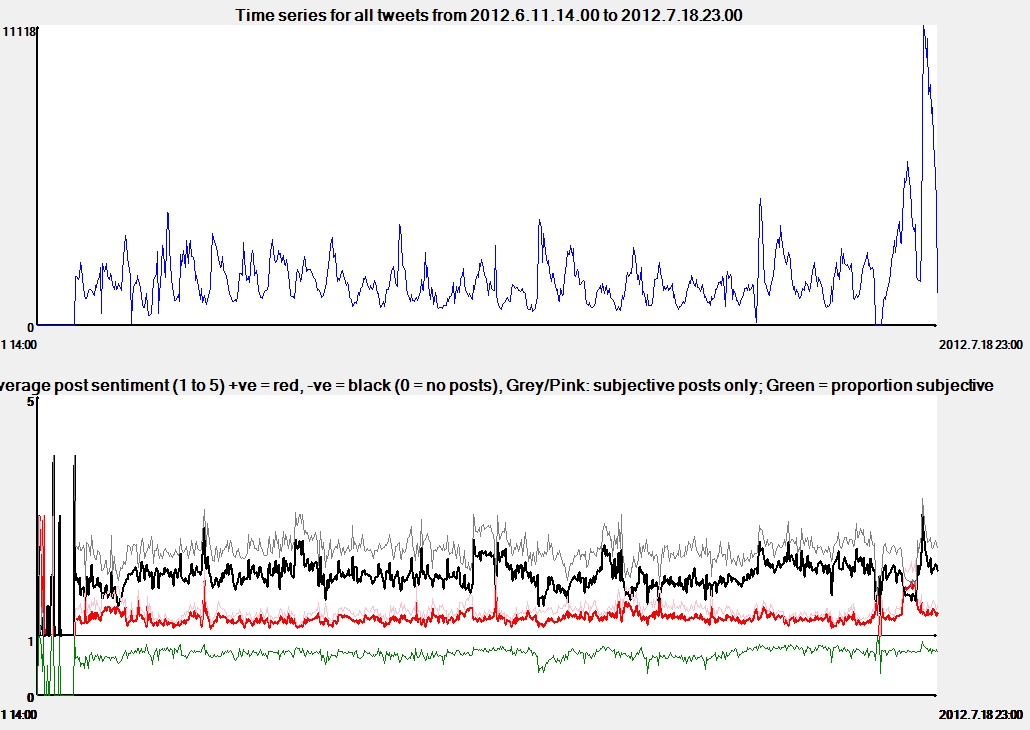
Overall graph: The topic Syria showing a bit increase in interest at the end (top) and high negativity (bottom).
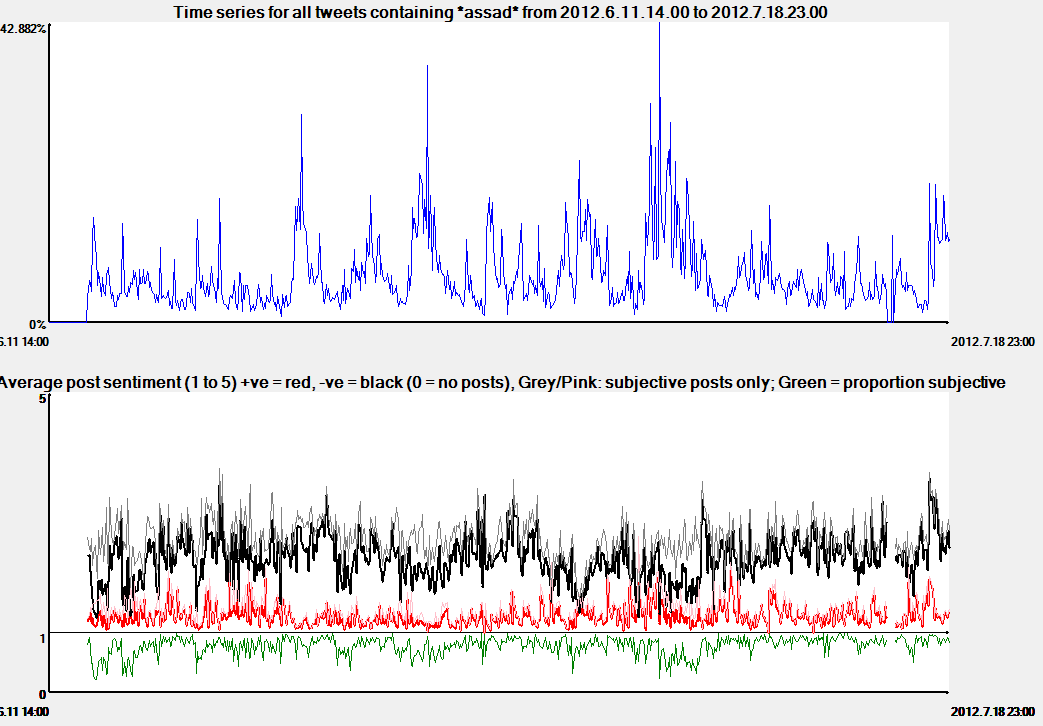
Example subgraph: The query Assad in the topic Syria showing several bursts of interest (top) and high negativity with period of moderate negativity (bottom). Investigating the causes of the bursts by reading tweets from the time period of each one should produce evidence of the three most significant events for Assad over this time period.
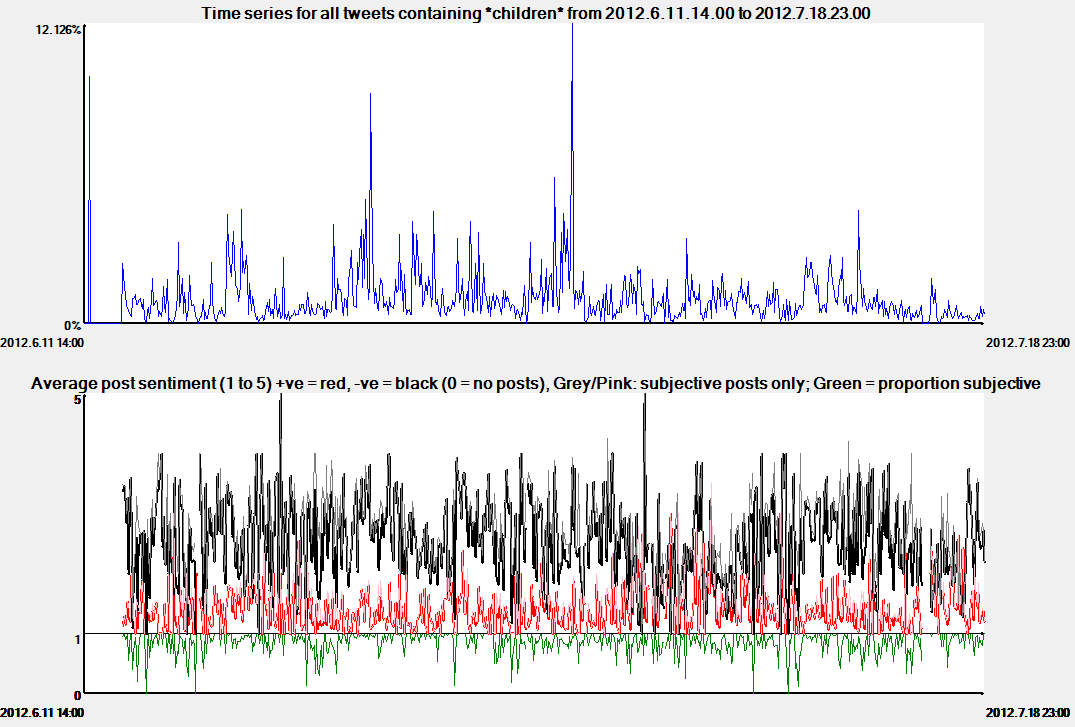
Example subgraph: The query children in the topic Syria showing three bursts of interest (top) and high negativity (bottom).Investigating the causes of the bursts by reading tweets from the time period of each one should produce evidence of the three most significant child-related events over this time period.
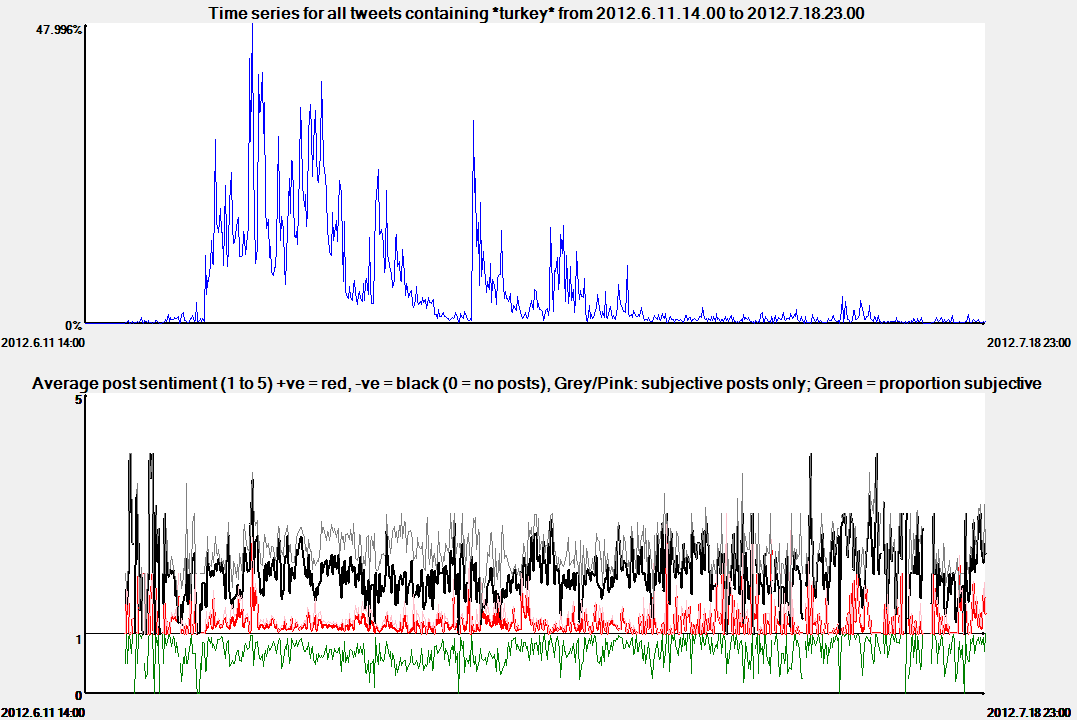
Example: The query Turkey in the topic Syria showing one major and three moderate bursts of interest (top) and moderate negativity (bottom).Investigating the causes of the bursts by reading tweets from the time period of each one should produce evidence of the for most significant events for Turkey in relation to Syria over this time period.
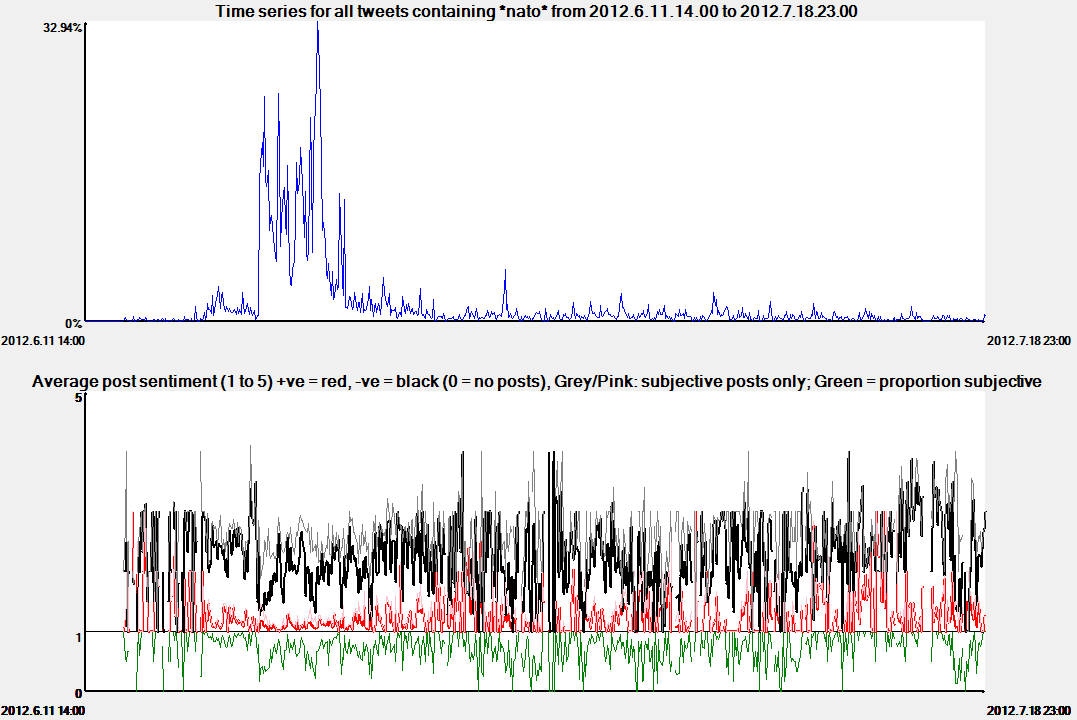
Example: The query NATO in the topic Syria showing one major burst of interest (top) and moderate negativity (bottom). This could be used as evidence that the involvemenr tof NATO was an issue that was raised in a particular time period but then left the world agenda, at least in public.
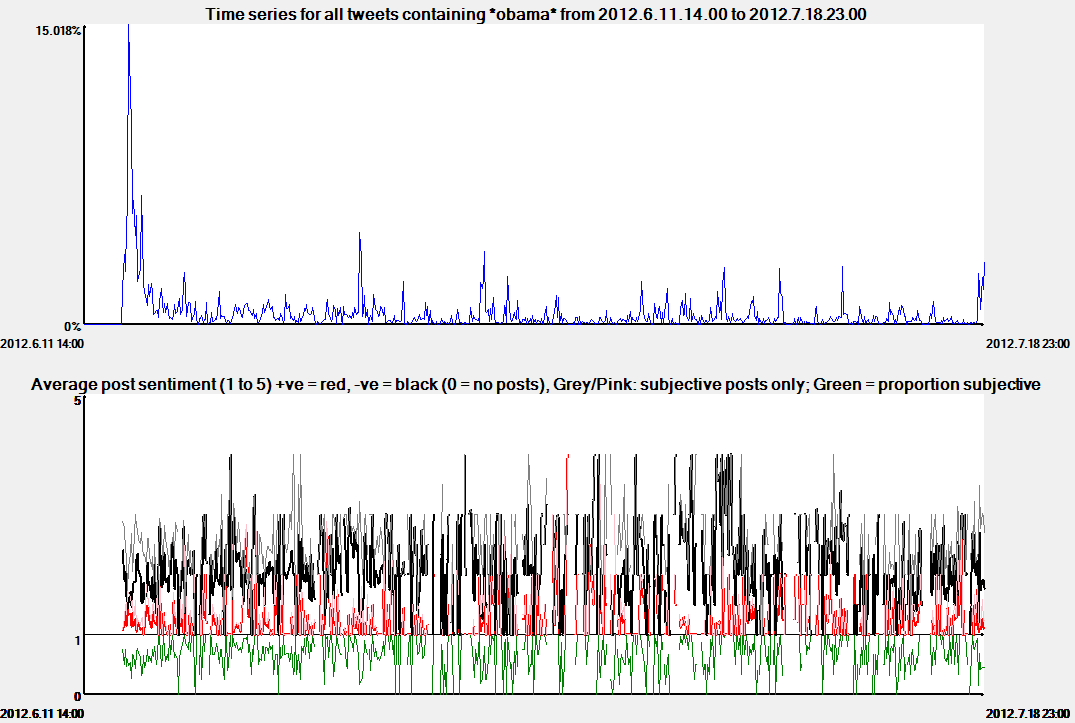
Example: The query obama in the topic Syria showing one major burst of interest (top) and moderate negativity (bottom).This could be used as evidence that US intervention was an issue that was raised in a particular time period but then left the world agenda, at least in public.
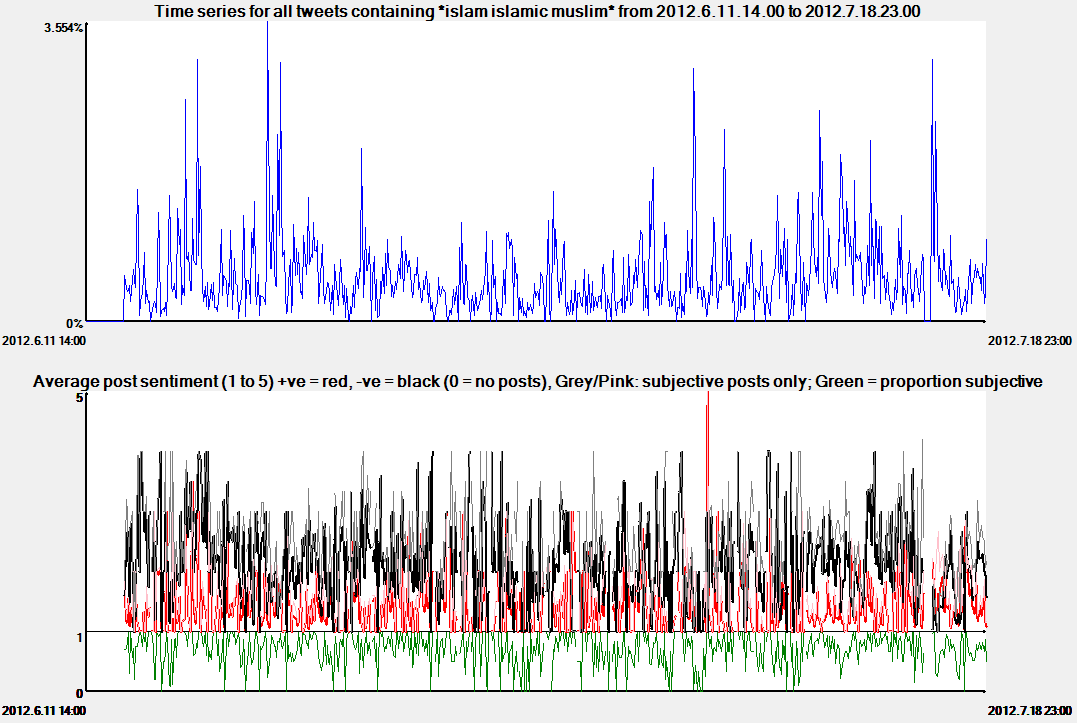
Example: The query islam islamic muslim in the topic Syria showing low levels of interest with some moderate burst of interest (top) and moderate negativity (bottom). The low level of overall interest suggests that islam was not a publicly discussed issue in relation to Syria during this period, at least in the English-tweeting world.
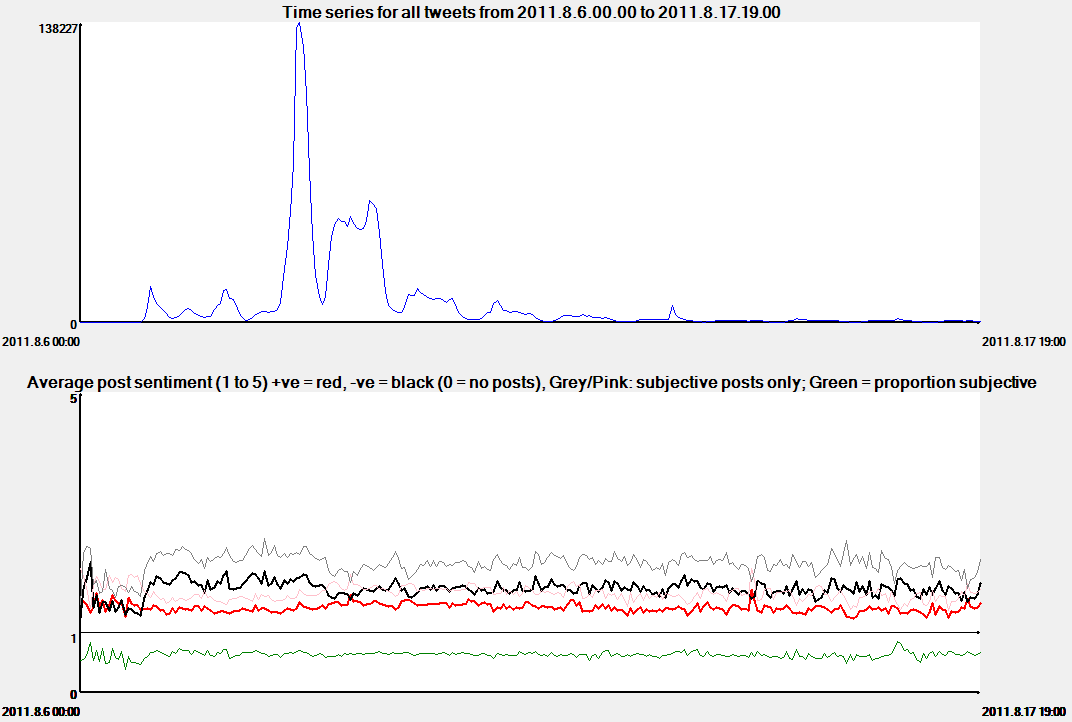
These graphs are taken from a Twitter corpus built from a set of UK riot-related queries.The graphs cover only a few days and show periodic flucutations due to a decrease in tweeting overnight.
Overall graph: The topic UK riots 2011 showing 2 major bursts of interest and daily fluctuations (top) and low to moderate sentiment (bottom).
Example subgraph: The query clean clean-up cleanup in the topic UK riots 2011 showing 2 bursts of interest (days) and low POSITIVE sentiment (bottom). This shows the time period in which this issue was mainly discussed, and the fact that this was seen as a mainly positive issue, in comparison to other riot-related issues.
 andd low POSITIVE sentiment.png)
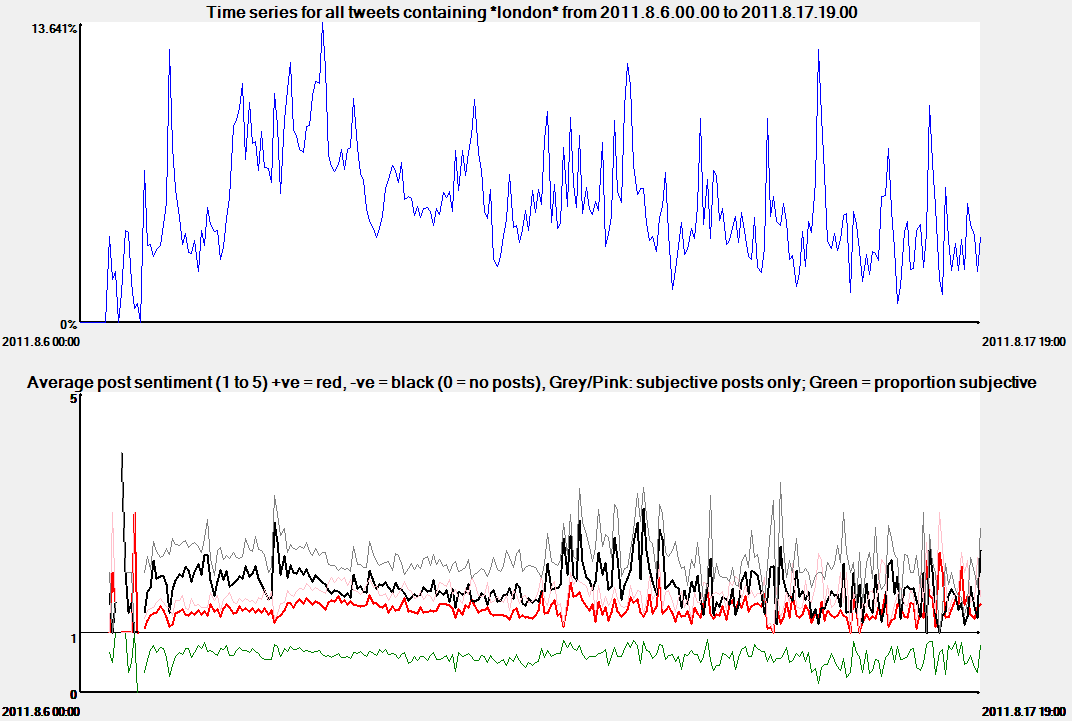
Example: The query london in the topic UK riots 2011 showing a decrease in interest over time, after the start (top) and moderate negative sentiment (bottom). Although London was the start of the riots and interest in it decreased, it remained a important topic.
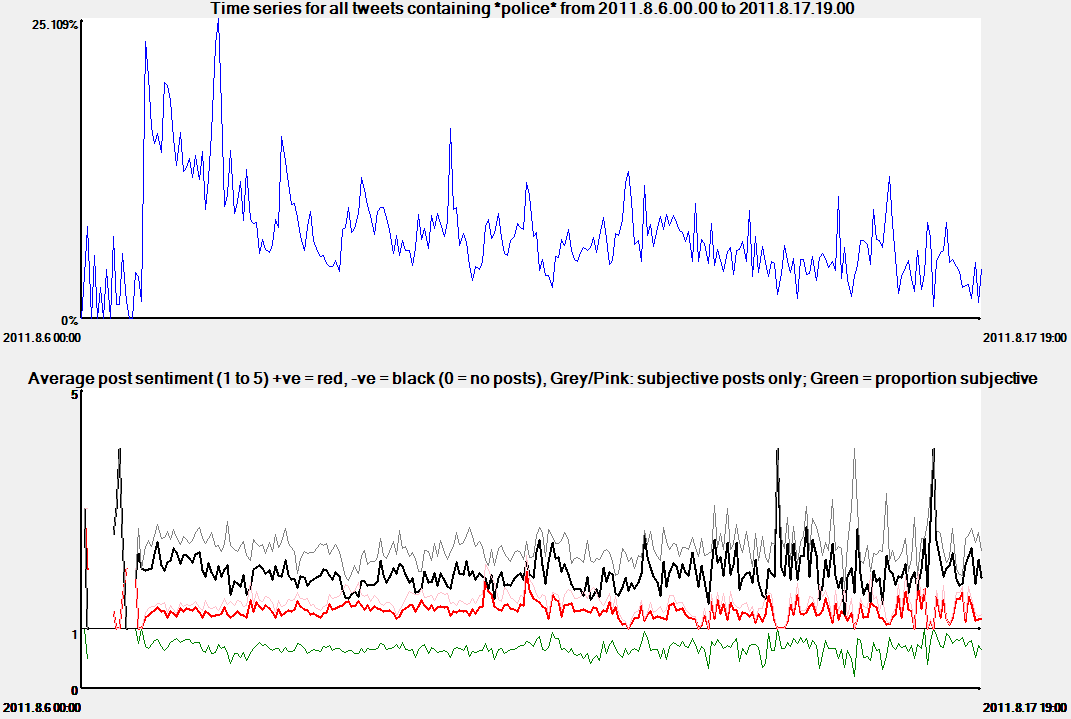
Example: The query police in the topic UK riots 2011 showing a decrease in interest over time and moderate sentiment (bottom).
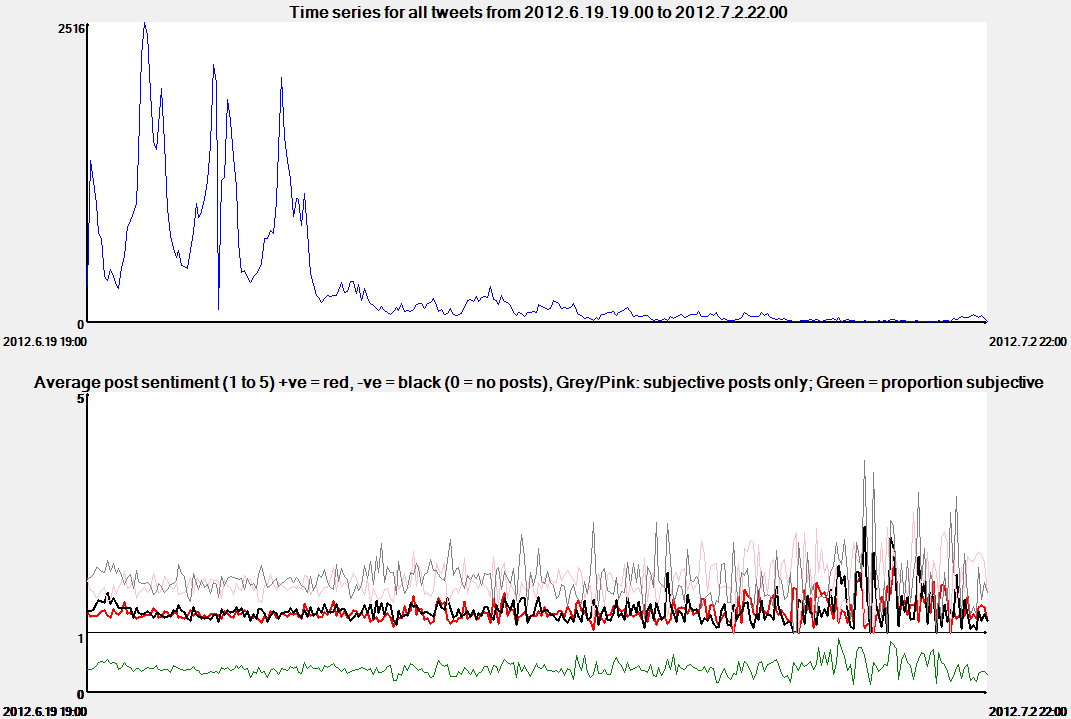
Overall graph: The topic Rio+20 Earth Summit 2012 showing 4 daily cycles of interest then quickly ending interest and one technical anomaly (top) and low sentiment (bottom).
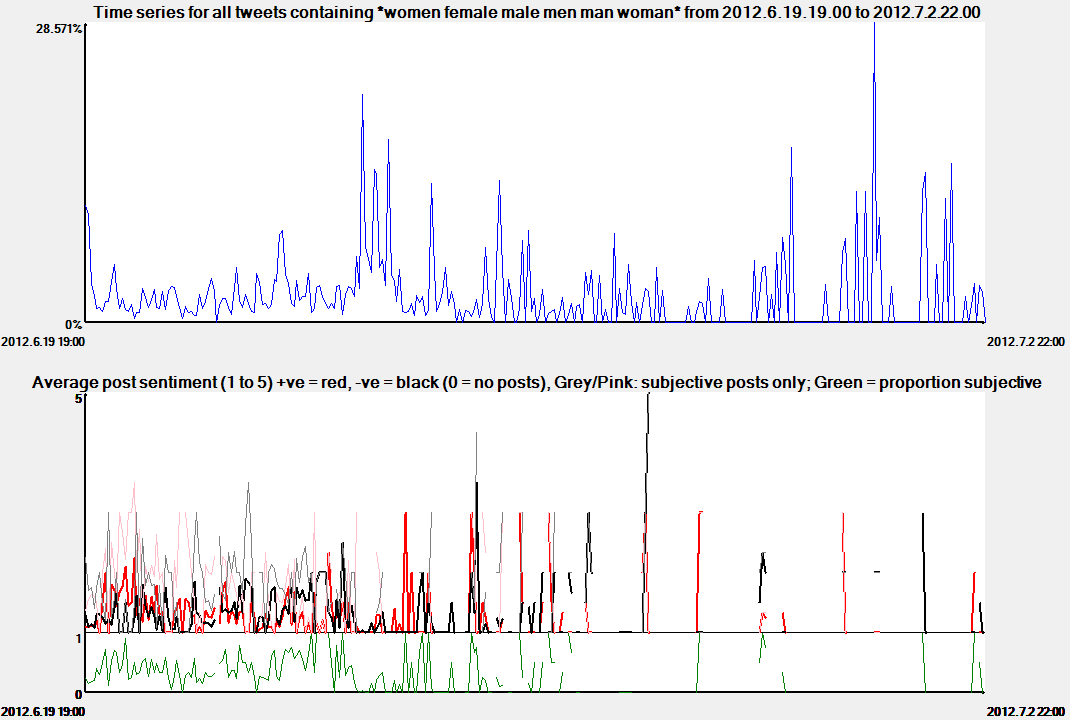
Example subgraph: The query women female male men man woman in the topic Rio+20 Earth Summit 2012 showing showing 1 burst of interest (top) and low sentiment (bottom). This subgraph was constructed to identify the time frame for the issue of gender within the conference.
| Made by the University of Wolverhampton during the CREEN and CyberEmotions EU projects and updated at the University of Sheffield. |